Graph Slider Filter
2012/10/28
This is an idea for an interface element I had. It uses an interactive graph to show information about data as well as manipulate that data.
Say you have a big table of things to be delivered with their dates. It is useful to display graphical information about that data as well as use that data to filter results. In this example, there is a small graph of the table results below showing the number of items available on each pickup date, giving the person looking at this data easily-understandable information about the volume of items for each day. By dragging the sliders or clicking and/or dragging on the graph, this person can narrow their results to certain dates of interest and get more information by reading the newly-filtered table. In a real scenario, this plot-slider control would be used in tandem with other search and filtering controls to help people understand the data. This particular control could even be a sparkline (much smaller and without axes) and this might still allow the person viewing the graph to obtain information about the data as well as filter it.
I am almost definitely not the first person to have this idea, but I find it worrisome that not only are there no easily-findable examples of this kind of control, but there are also no public code libraries to achieve this functionality.
Update: Kayak.com does this exactly right when filtering flight results by time of take-off:
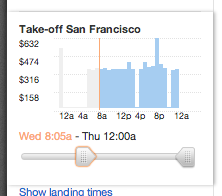
You can view my demo below.